

Have you ever wanted to know which digital marketing campaign is driving higher traffic to your website? Do visitors who come from Facebook spend more time on your website or the ones coming from a banner? Want to know what the bounce rate & click-through rate (CPR) is for your paid search campaigns?
One of the most critical (yet often overlooked) facets of digital marketing is having your analytics correct. Being able to monitor where your website visitors are coming from can help improve customer engagement and ROI in the long run. On the other hand, performance tracking and analysis will help enhance your digital campaigns in the future, while allowing you to manage your budget effectively.
The Power of Google Analytics with You!
Google brings to you a powerful web analytics tool – Google Analytics – to help measure campaign performance in real time, compare critical data, and so much more. If you have invested in one or more digital marketing strategies, Analytics can show you valuable data from all channels that are bringing traffic to your website. This includes Organic Search or SEO, Social Media, Paid Search or PPC, Direct Traffic and Backlinks.
The analytics tool helps you track all the digital marketing platforms and review which one is working well in terms of brand promotion, and which is not. The best thing is that you can collate all data in one place, making it easier to compare performance of different platforms.
Is your PPC campaign not performing as expected? A peep into the vital metrics like time-on-page or bounce rate can help identify the tweaks required to improve PPC performance. Want to make the most out of your social media campaign? Let Google Analytics help you with data on well-performing and non-performing channels!
Unveil the power of Google Analytics in this article to improve your digital campaign.
Tips to Use Google Analytics to Ensure Digital Marketing Success
The Google web analytics tool offers hundreds of diverse metrics, all of which may not be important for your digital marketing campaign. Few core components that you should analyse are User Behaviour, Traffic Channels and Site Content. Here’s how to go about with Google Analytics.
1. User Behaviour
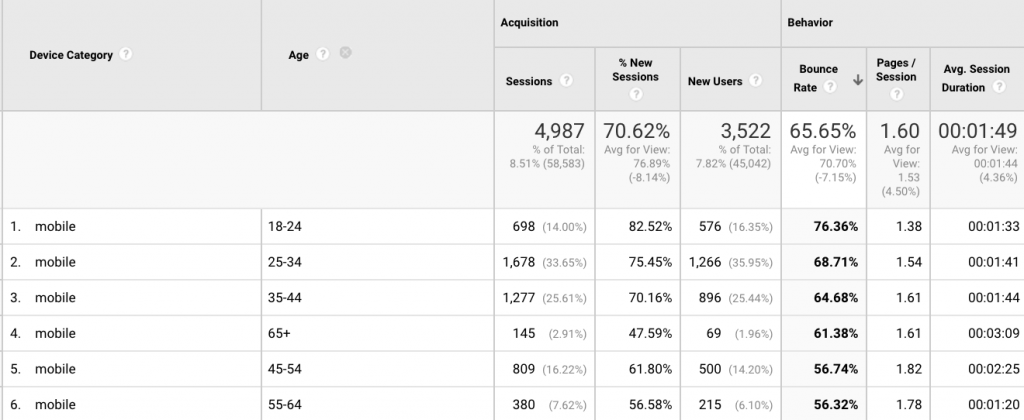
Understanding your audience, demographics and their behaviour is the key to have better conversions. Google Analytics’ ‘Audience’ section provides valuable insights, helping you understand what type of audience will engage with your website, inquire for your products or services, or buy. Understanding audiences in terms of age, interests and gender helps you create or recreate content to target different sets of customers. Analysing the audience tab is important to identify user behaviour to build hypothesis for conversion optimisation.
Tracking the ‘Audience’ tab helps identify:
- The bounce rate
- Which demographic segment is contributing to the highest conversion rate
- Which device is accounting for the highest bounce rate or conversion rate
- Gender performance
- Customer interest data
- Page session and Average Session Duration
- Sign in to your Google Analytics account
- Open Reports
- Choose Audience > Demographics or Audience > Interests
As in the example given below, you can segment the data as per Device Category and then add Age Dimension to sort the list as per Bounce Rate.
2. Traffic Channels
If you have several digital campaigns to monitor, one of the best and simplest ways is to track your traffic channels report on Google Analytics. This will help you identify which marketing efforts are paying off well and which ones need to be revised. The report provides insights on through which channel people are visiting your website. Below is how you can track performance of all your digital marketing channels:
- Sign in to Google Analytics
- Open Acquisition > All Traffic > Channels
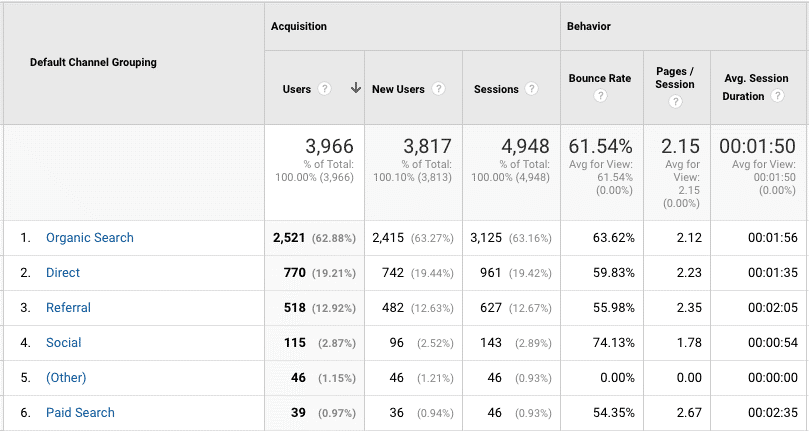
Different types of traffic channels as found on Google Analytics are:
- Organic Search: This demonstrates website traffic coming from Search Engine Result Pages (SERPs) owing to your Search Engine Optimisation efforts. Analysing the report, you can improve on-site and off-site SEO strategies to drive more organic traffic.
- Direct: This metric highlights visitors coming directly to your site, i.e. via a bookmark or typing website’s URL into the address bar, etc.
- Referral: This type of traffic comes from your website links on other content or websites. Backlinks from reputable sites can improve your authority and ranking, while poor-quality links can pull you down. Therefore, it is important to monitor performance of backlinks through Google Analytics.
- Social: This shows the traffic coming from different social media platforms. Analyse the report deeper to identify which platforms are performing well and which needs improvements.
- Paid: This metric highlights the traffic coming from Paid Search, i.e. Pay-Per-Click advertising.
Email and display advertising forms ‘Other’ category of incoming traffic to your website.
3. Site Content
To know the performance of different web pages or what type of content needs improvement, utilize Analytics’ insightful sub-sections like:
- All Pages – Google Analytics > Behaviour > Site Content > All Pages
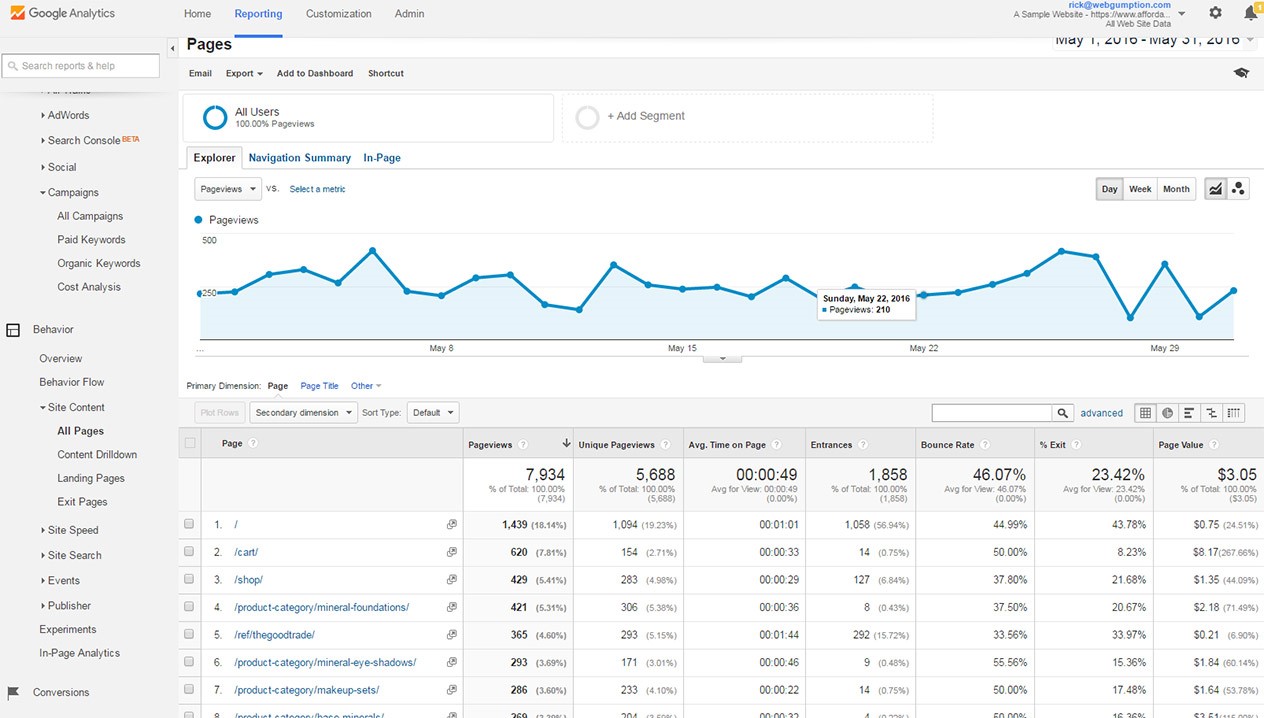
This Analytics’ report offers a comprehensive view of each website page with metrics including page views, average time on page, unique page views, entrances, bounce rate, page value, and % exit.
- Landing Pages – Google Analytics > Behaviour > Site Content > Landing Pages
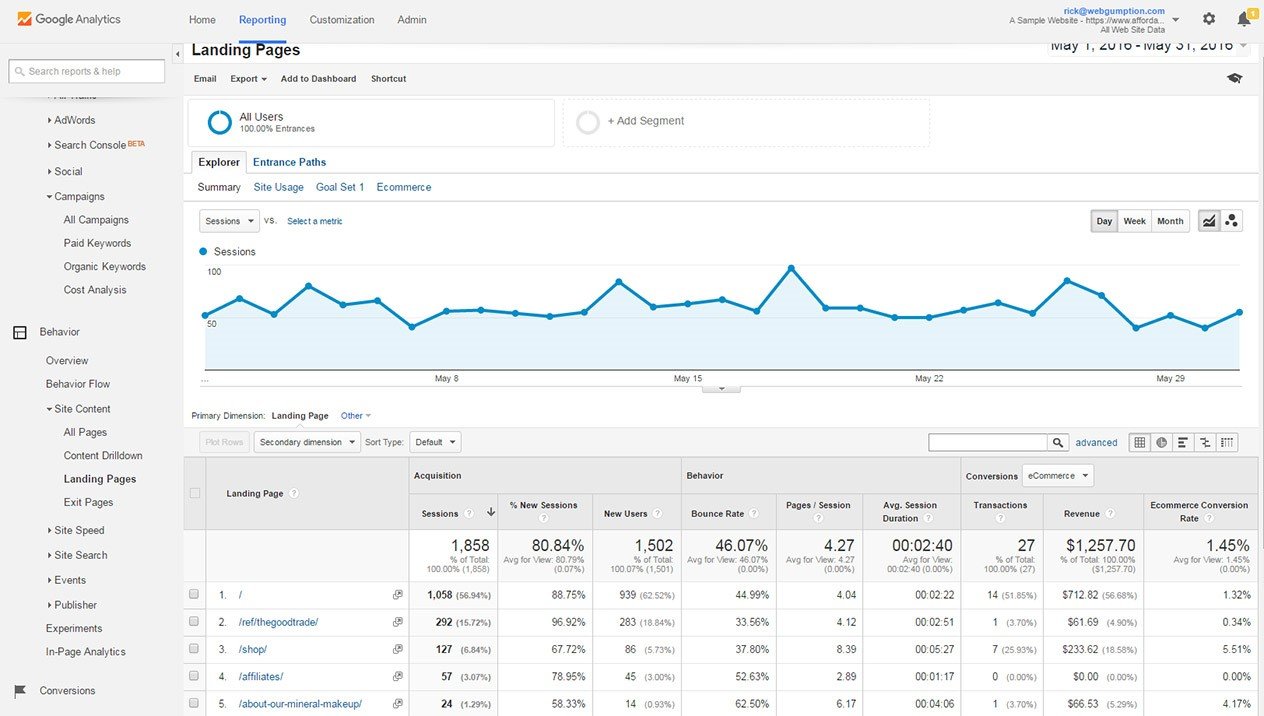
Analysing performance of your landing pages is crucial because it is the first page that your website visitor sees. i.e. it creates the first impression on their minds. Use the report to identify which landing pages have a low or high conversion, bounce rate, etc.
- Content Drilldown – Google Analytics > Behaviour > Site Content > Content Drilldown
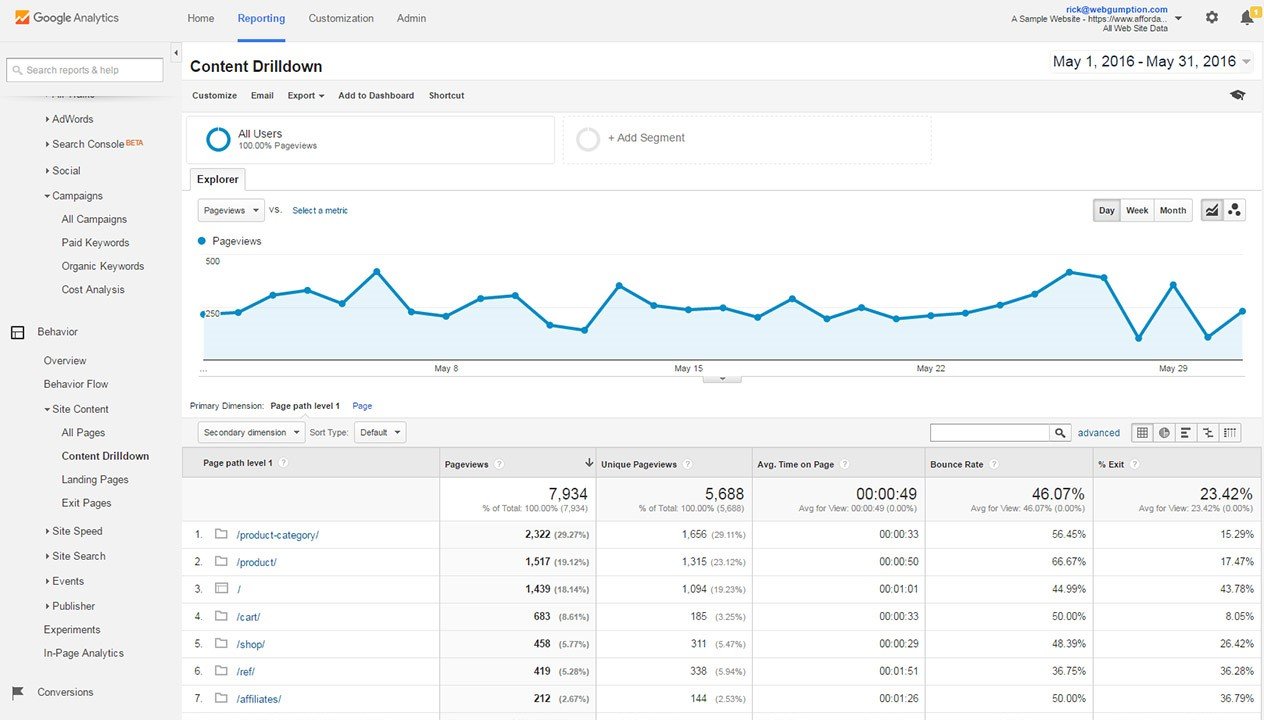
The report presents the same data as in All Pages, with the same metrics, but is categorised by sub-folders. This actually highlights how organised your website is and how well visitors are interacting while navigating through the site.
- Exit Pages – Google Analytics > Behaviour > Site Content > Exit Pages
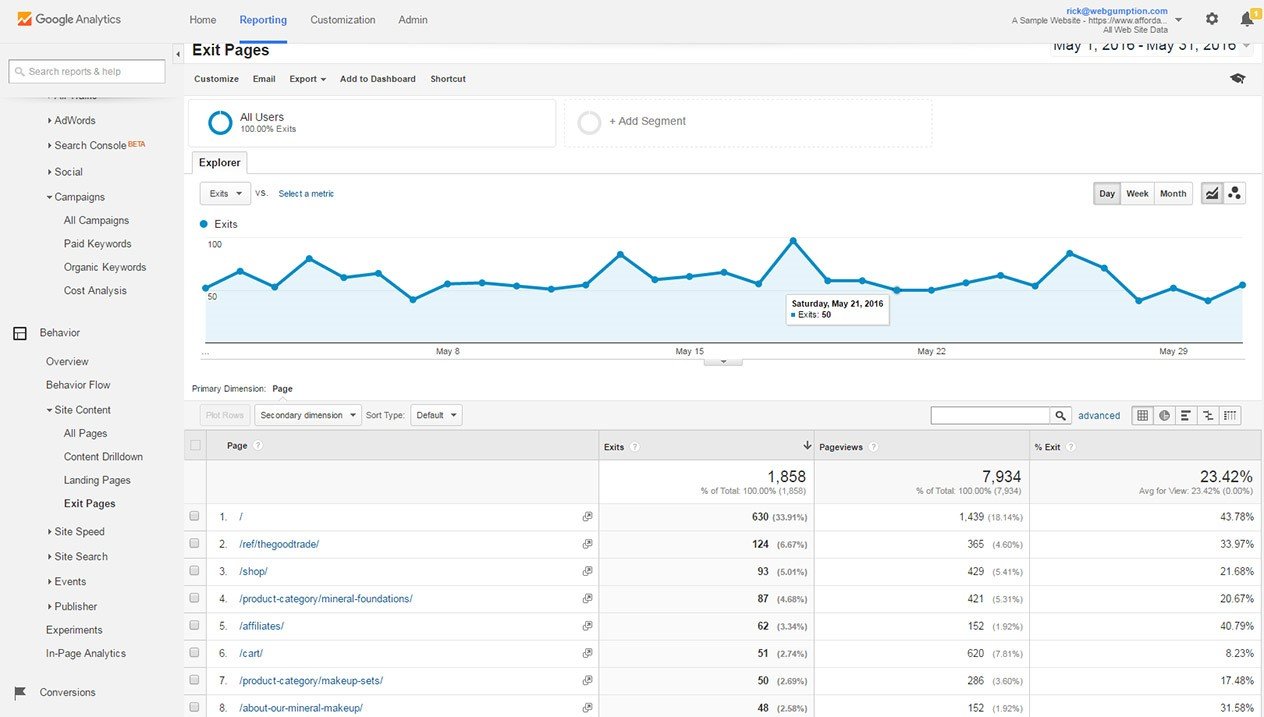
The report shows the pages from which the visitors exit the website. With this report, you can identify the pages which are not meant for exit. Likewise, improvements could be made for those pages.
Conclusion
Google Analytics is undoubtedly the industry standard to measure digital marketing performance. However, with the sheer amount of data available on Analytics, it might be overwhelming for you at first. But the more you dig into the reports, the better you will be able to monitor your digital marketing spends. Likewise, you can make improvements to generate high traffic, improve sales and increase ROI.